Over six articles, one project has been built from the ground up: an area statement, a cost stack of SAR 887M, a pre-sales program, a financing structure, and a P&L running two engines at once. This article answers the question all of that exists to serve: what does the investor get, and when?
The answer is never one number. A defensible returns tab produces at least three IRRs, a multiple, and, where the asset sits inside a fund or vehicle, a waterfall. Each one answers a different question from a different person in the room.
Before the returns: what flows in
The returns calculation consolidates everything the series has built. On the way out: land, construction, soft costs, contingency, developer fee, and financing cost, phased over the construction period. On the way in: residential collections through handover, the hotel earning its gross operating profit year after year, the retail earning its net operating income, and, at the end of the hold, the exit.
The exit deserves its own line of discipline: operating assets are valued at exit on stabilized income, not on cost. The hotel and retail from the previous article, earning roughly SAR 25M and SAR 15M a year respectively, are capitalized at market yields at the point of sale, and that terminal value is usually the single largest cash inflow in the entire model. An IC will always test the exit assumptions first, because the returns are most sensitive to them.
Project IRR: the unlevered truth
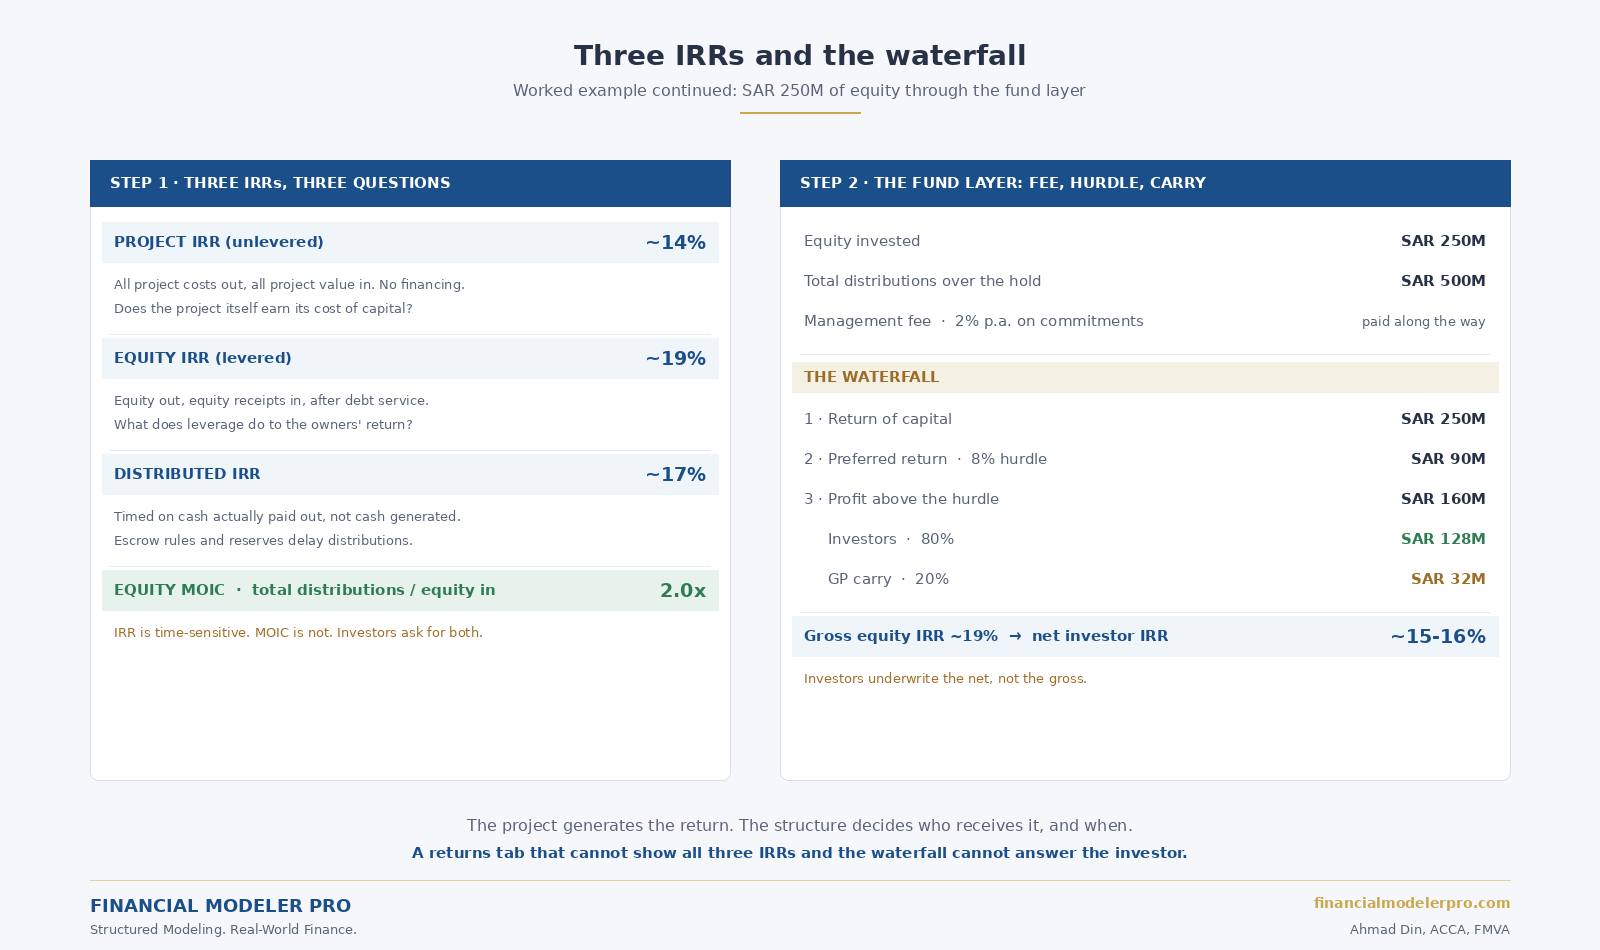
Project IRR is calculated on the project cash flows alone: all costs out, all revenues and exit value in, with no debt, no interest, no financing at all. In our example it lands around 14%.
This is the number that describes the project rather than the deal. It answers: does this development, on its own merits, earn more than the cost of capital for this risk? It is also the number that survives negotiation. The debt package can change, the equity split can change, the fund terms can change, and the project IRR does not move. When two parties argue about a transaction, the project IRR is the common ground they can both verify.
Equity IRR: what leverage does
Equity IRR is calculated on the equity cash flows: SAR 250M of contributions out, including the in-kind land at its agreed value, and everything the equity receives back after debt service. In our example, roughly 19%.
The five-point spread over the project IRR is leverage doing its work: the facility costs 6.5%, the project earns 14%, and the difference accrues to the equity. The same mechanism runs in reverse when a project underperforms, which is why the equity IRR should always be read next to the project IRR, not instead of it. A strong equity IRR on a weak project IRR is a financing trick, not a good project.
Distributed IRR: when cash actually leaves
The third IRR is the one most models skip, and the one shareholders feel most directly. Equity IRR assumes the equity receives cash when the project generates it. In practice, it does not. Escrow regulations control when residential collections can be released. Lenders require reserves. Operating assets hold working capital. Boards time distributions around their own calendars.
Distributed IRR is timed on the cash actually paid out to shareholders. In our example it runs around 17%, two points below the equity IRR. That gap is the cost of cash being trapped inside the structure, and it is real: an investor cannot spend cash that is generated but not distributed. Modeling the distribution rules explicitly, rather than assuming instant payout, is what separates a returns tab an investor can rely on from one they have to re-derive themselves.
MOIC: the number that keeps IRR honest
Multiple on invested capital is total distributions divided by total equity invested: SAR 500M over SAR 250M in our example, a 2.0x.
IRR is time-sensitive and MOIC is not, which is exactly why investors ask for both. A quick flip can produce a spectacular IRR on a thin absolute profit; the MOIC exposes it. A long patient hold can show a modest IRR while doubling the money; the MOIC defends it. Each metric keeps the other honest, and a returns summary that shows only one of them is choosing which half of the truth to tell.
The fund layer: fee, hurdle, carry
When the asset sits inside a fund or an investment vehicle, one more layer stands between the project and the investor, and it changes the answer materially.
The standard architecture has three parts. A management fee, typically around 2% per year on committed capital, paid to the manager regardless of performance. A preferred return, or hurdle, typically around 8%: investors receive their capital back plus this return before the manager participates in profits. And carried interest, typically 20% of profits above the hurdle, the manager's share of the upside.
Run our example through that waterfall. Equity in: SAR 250M. Total distributions over the hold: SAR 500M.
- Tier 1, return of capital: the first SAR 250M goes back to the investors.
- Tier 2, preferred return: the 8% hurdle, accrued on invested capital over the hold period, roughly SAR 90M, also to the investors.
- Tier 3, the split: the remaining SAR 160M of profit divides 80/20. Investors receive SAR 128M. The manager's carry is SAR 32M.
Add the management fees paid along the way, and the gross equity IRR of roughly 19% lands at roughly 15 to 16% net to the investor. Fund structures vary, some include a GP catch-up tier, some calculate the hurdle deal by deal rather than on the whole fund, but the modeling principle does not: the waterfall must be built tier by tier, in cash, in time, because the fee and carry mechanics are themselves time-sensitive.
The gross-to-net gap is not a detail. Investors underwrite the net. A returns presentation that shows gross returns to an investor who receives net returns is not a simplification, it is a misstatement of what they are buying.
What the returns tab must answer
Pulling the series together: the returns tab is where every earlier decision becomes visible. The area statement set the revenue ceiling. The cost stack set the investment. The pre-sales program shaped the collections. The financing structure decided the leverage and its cost. The two P&L engines produced the operating income and the exit value. The returns tab consolidates all of it into the three IRRs, the MOIC, and the waterfall, and it should be able to answer, in one view, the only question that closes a transaction: what do I get, and when?
This article completes the modeling arc of this series. What comes next is something I have been building toward for a long time. More on that very soon.
Preparing an investor presentation or fund structure for a KSA transaction?
I take on selective advisory engagements for real estate developers, family offices, and investors across KSA and the GCC. Return analysis, waterfall structuring, IC presentations, and the full modeling discipline this series has described.