The series so far has built one project from the ground up: an area statement, a cost stack of SAR 887M, a pre-sales program with three curves, and a financing structure that funds the gap. This article completes the P&L, and it starts with a distinction most mixed-use models blur: the project is running two completely different businesses at once.
Engine 1 develops and sells. It earns its margin once, spread over the recognition period, and then it is finished. Engine 2 operates and holds. It earns every year, for as long as the assets are held. The two engines have different revenue logic, different cost logic, different margin shapes, and different audiences asking questions about them. A model that blends them into one revenue line can answer questions about neither.
Engine 1: cost of sales follows recognition, not collections
The pre-sales article established the revenue rule: recognized revenue on sold units is capped by construction completion. Cost of sales obeys a matching rule that mirrors it exactly: COGS is recognized in the same proportion as the revenue it relates to.
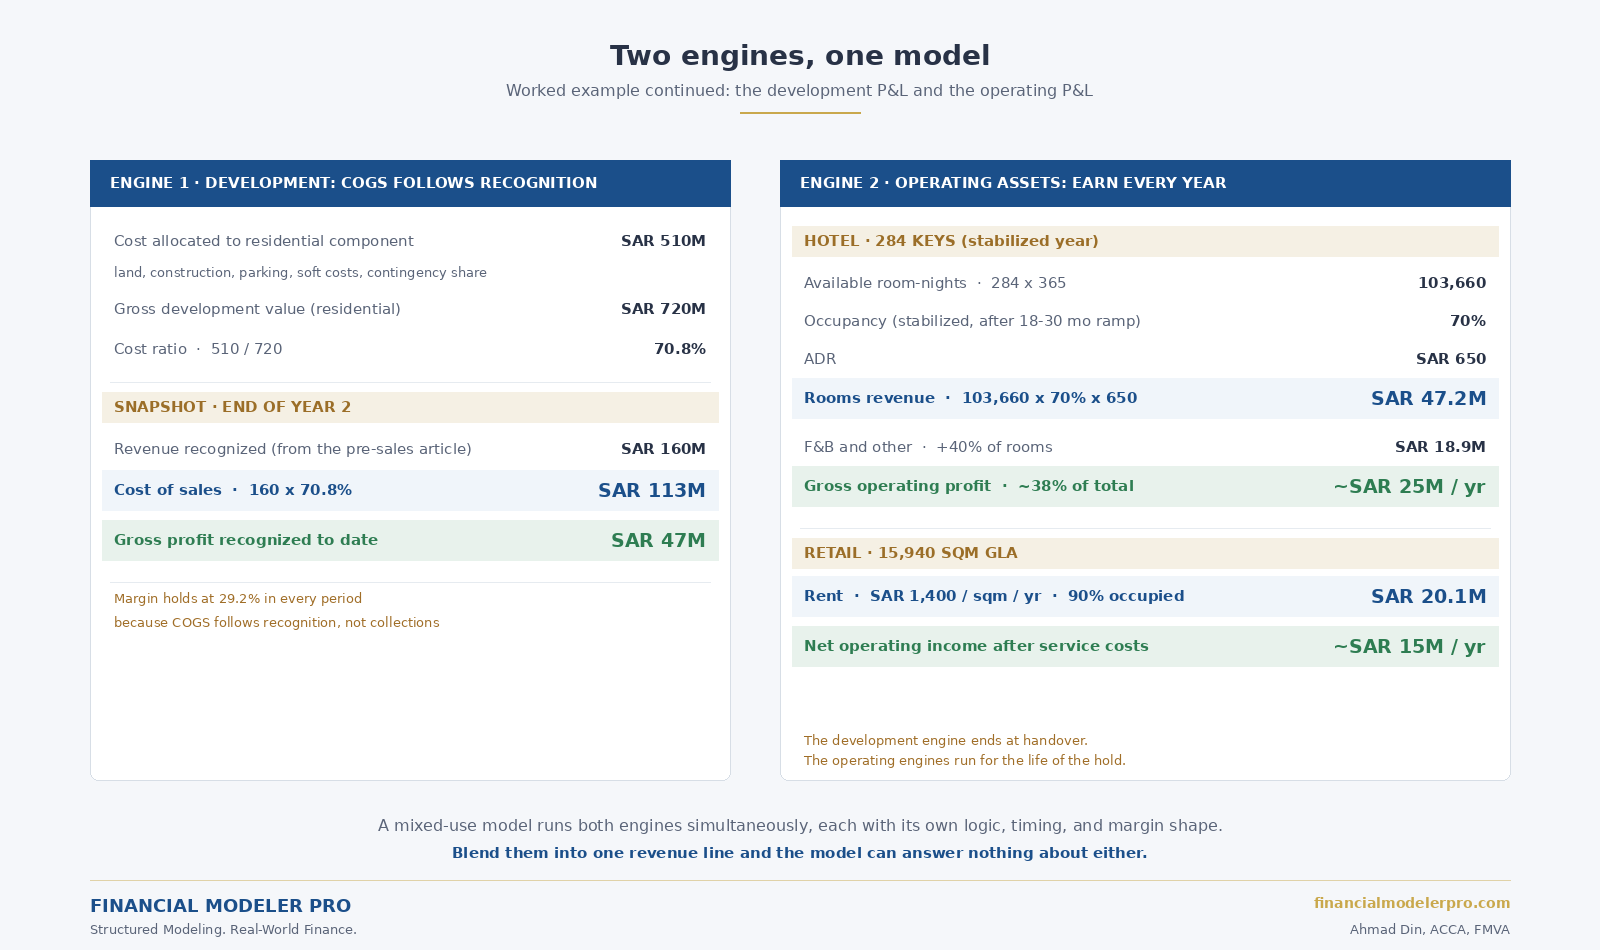
First, the cost side needs an allocation. From the cost stack, the residential component carries its share of land, its own construction cost, its share of parking, and its proportionate share of soft costs, contingency, and developer fee. In the worked example, that allocation comes to roughly SAR 510M against a residential GDV of SAR 720M. Cost ratio: 70.8%. Development margin: 29.2%.
Now apply the matching rule at the Year 2 snapshot from the pre-sales article:
- Revenue recognized to date: SAR 160M
- Cost of sales: 160 x 70.8% = SAR 113M
- Gross profit recognized to date: SAR 47M
The margin holds at 29.2% in every period, because both sides of the P&L move on the same driver: completion. That stability is not cosmetic. It is what makes the reported numbers interpretable. When the margin moves in a properly matched model, it means something real happened: a cost overrun, a price change, a mix shift. It is a signal, not noise.
Match COGS to collections instead, or worse, expense costs as incurred while recognizing revenue on completion, and the margin swings wildly period to period. Early periods show fictional losses or fictional profits, later periods show the reverse, and neither the CFO nor the auditor can read anything from the trend. The cumulative totals eventually converge, but every interim reporting period along the way is wrong.
One practical note on the allocation itself: the cost ratio should be maintained per project or per phase, and revisited when the cost plan changes. A contingency release or a construction saving changes the ratio, and the matched COGS should reflect the updated expectation, not the original budget.
Engine 2: the operating assets
The hotel and the retail component were sized in the area statement at the very start of this series: 31,250 sqm of GFA became roughly 284 hotel keys, and 18,750 sqm of GFA became roughly 15,940 sqm of leasable retail area. Those two numbers now become annual revenue engines.
The hotel engine
Hotel revenue is built from three drivers, and the discipline is keeping each one explicit:
- Available room-nights: 284 keys x 365 = 103,660 per year. Fixed by the area statement.
- Occupancy: ramping from opening toward stabilization over 18 to 30 months, then holding at a stabilized level, 70% in this example. The ramp matters: a hotel does not open full.
- ADR: SAR 650 in this example, with its own growth curve driven by the market segment, not by blanket inflation.
Stabilized rooms revenue: 103,660 x 70% x 650 = SAR 47.2M per year. Food and beverage and other operating revenue add roughly 40% of rooms revenue in a property of this type, another SAR 18.9M. After departmental costs and undistributed expenses, gross operating profit lands around 38% of total revenue, roughly SAR 25M per year, before management fees and fixed charges.
The operating cost structure deserves the same driver discipline as revenue: labor steps up in occupancy bands, amenities move per occupied room, utilities carry a fixed base plus a variable component. A flat cost percentage cannot flex through the ramp years, and the ramp years are exactly when the lender is watching coverage.
The retail engine
Retail is the simplest of the three components, which is precisely why its few drivers deserve care: 15,940 sqm of GLA, at an average rent of SAR 1,400 per sqm per year, at 90% stabilized occupancy, produces SAR 20.1M of rental income. Lease escalations, typically stepped every few years, drive the growth. After service costs and non-recoverable expenses, net operating income runs around SAR 15M per year.
Retail also carries its own ramp: a leasing-up period from handover to stabilized occupancy, with incentives and fit-out contributions that belong in the early-year cash flows.
Why the engines must stay separate
Each engine answers different questions for different audiences:
- The development P&L tells the sponsor and the IC whether the trading margin is intact: is the project still earning the 29% it was underwritten at?
- The operating P&L tells the operator, the asset manager, and the eventual valuer what the assets earn in a normal year: the GOP and the NOI that drive holding decisions and exit values.
They also behave differently in time. The development engine ends at handover: once the last unit is delivered and recognized, it contributes nothing further. The operating engines start slowly, ramp, stabilize, and then run for the life of the hold, and at exit they are valued on their stabilized income, not on their cost.
A structured mixed-use model keeps the engines separate through the P&L and brings them together only where they genuinely combine: the consolidated cash flow, the financing that serves the whole project, and the returns. That is also exactly where this series goes next.
Next in this series: return analysis, project IRR, equity IRR, the exit, and the fund layer of fees, hurdles, and carry that sits between the project and the investor.
Modeling a mixed-use development in KSA?
I take on selective advisory engagements for real estate developers, family offices, and investors across KSA and the GCC. Mixed-use feasibility, operating asset projections, IC presentations, and the two-engine discipline this article describes.