Every developer starts with the same question: what is the highest and best use of this land?
Sell it as residential? Operate it as a hotel? Lease it as retail? Or a mix of all three? It is the first question in every feasibility conversation, and it is the question the financial model exists to answer.
Yet in most models I review, the area statement, the layer that holds this decision, is an afterthought. A few hardcoded numbers at the top of a revenue tab. When the master plan changes, and it always changes, those hardcoded numbers are why the model breaks.
Here is how I structure it instead.
The area statement is the foundation, not a formality
Every number downstream inherits from the area statement. Residential revenue is a function of sellable area. Hotel revenue is a function of key count. Retail revenue is a function of leasable area. Construction cost is a function of built-up area by asset type. Financing need is a function of cost. Returns are a function of everything above.
Get the area layer right, and the model has a spine. Get it wrong, or hardcode it, and every change request becomes surgery.
Step 1: From land to permissible GFA
The starting point is the plot and its planning parameters. Plot area multiplied by the floor area ratio gives the permissible gross floor area, the total built-up area the regulations allow.
In our worked example: a 50,000 sqm parcel with a FAR of 2.5 gives 125,000 sqm of permissible GFA. That is the envelope. Everything the project will ever earn has to come from inside it.
In practice this step carries more detail: net developable area after road and utility dedications, height restrictions that cap certain uses, and parking requirements that consume GFA without earning revenue. A structured model holds these as explicit inputs, not buried adjustments.
Step 2: The allocation decision, sell, operate, or lease
This is the highest and best use decision expressed in numbers. Each use class gets a share of the GFA, and each share behaves differently in the model:
- Sell assets (residential, offices for sale): revenue arrives through unit sales, usually off-plan with installment collections. Capital comes back early but once.
- Operate assets (hotels, serviced apartments): revenue arrives through operations, year after year. Capital comes back slowly but the asset keeps earning.
- Lease assets (retail, offices for lease): recurring rental income, valued on yield at exit.
The split between these three is the single most consequential decision in the model. It determines the cash flow shape, the financing need, the risk profile, and the exit story.
Step 3: Converting GFA into revenue-driving area
Gross floor area is not what earns money. Each use converts GFA into its own revenue-driving measure, through its own efficiency logic:
Residential converts through sellable efficiency. Corridors, cores, lobbies, and services consume area that cannot be sold. A typical sellable efficiency runs 75% to 85% depending on design.
Hotel converts through gross area per key. This includes the room itself plus its share of lobbies, restaurants, back-of-house, and circulation. Upscale properties typically run 90 to 120 sqm of gross area per key.
Retail converts through leasable efficiency, the share of GFA that becomes GLA a tenant actually pays for.
The worked example
Putting the three steps together for our 50,000 sqm parcel:
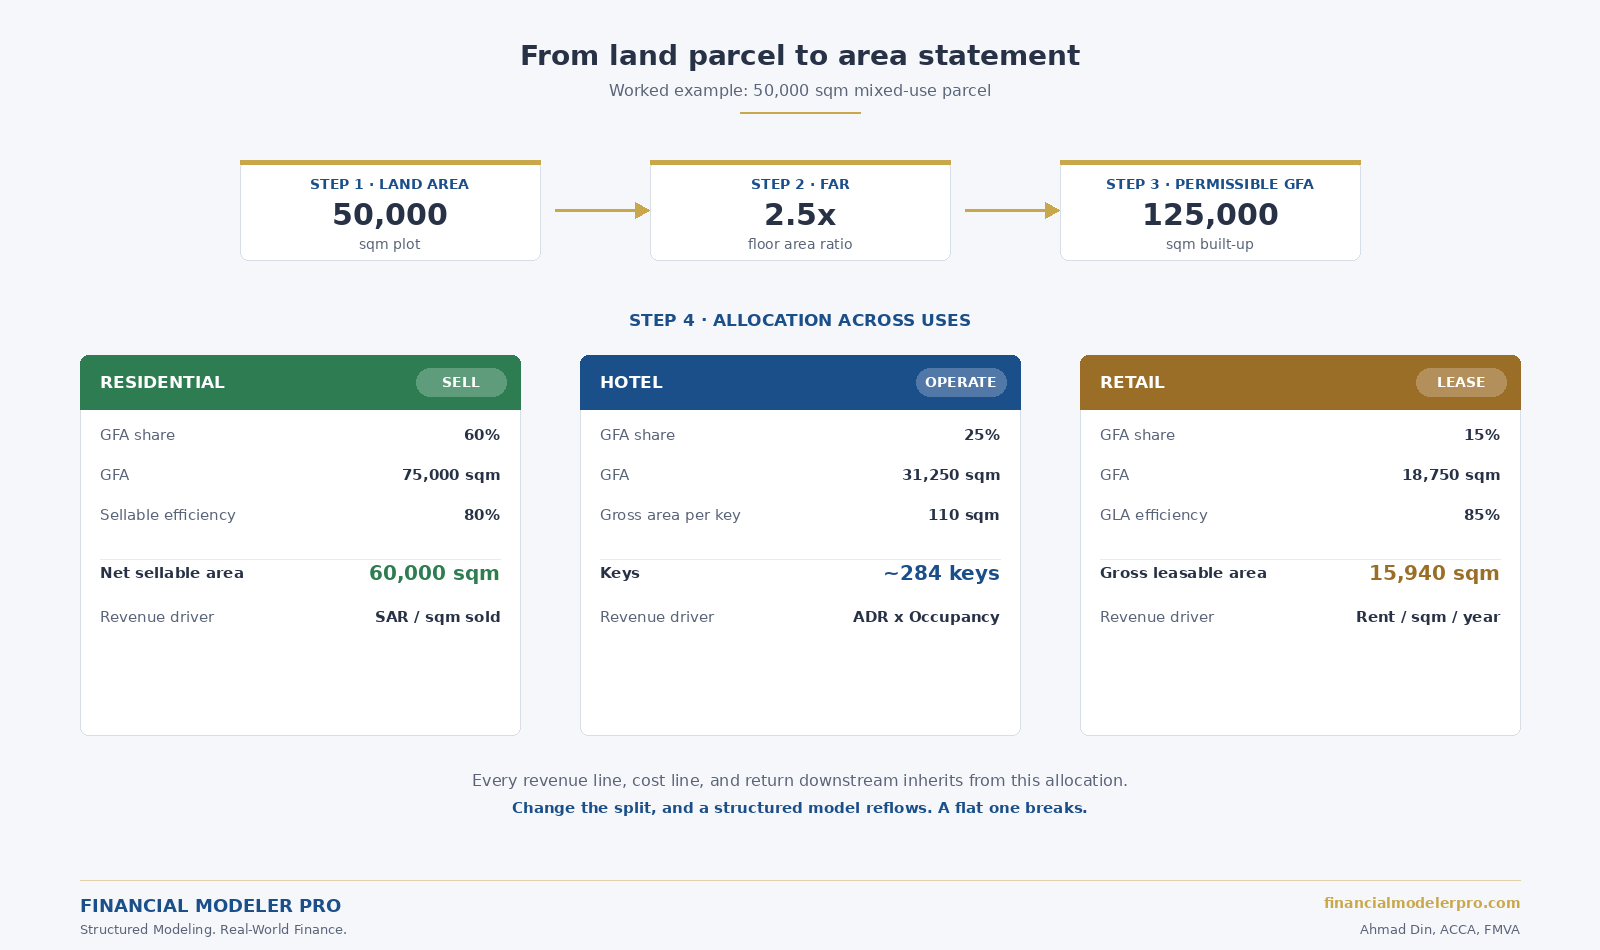
Land and envelope. 50,000 sqm plot at 2.5 FAR = 125,000 sqm permissible GFA.
Allocation. Say the master plan allocates 60% residential, 25% hotel, 15% retail.
Residential: 60% of 125,000 = 75,000 sqm GFA. At 80% sellable efficiency, net sellable area = 60,000 sqm. Revenue driver: sale price per sqm. At an illustrative SAR 12,000 per sqm, gross development value from residential alone = SAR 720 million.
Hotel: 25% of 125,000 = 31,250 sqm GFA. At 110 sqm gross per key, that yields roughly 284 keys. Revenue driver: ADR times occupancy times available room-nights, year after year.
Retail: 15% of 125,000 = 18,750 sqm GFA. At 85% leasable efficiency, GLA = roughly 15,940 sqm. Revenue driver: rent per sqm per year, with escalations, valued on yield at exit.
How the highest and best use test actually works
The example above is one allocation. The highest and best use analysis is running several: 70/20/10, 50/30/20, 100% residential, and comparing what each scenario produces.
The comparison metric depends on the owner. A trader compares gross development profit and how fast capital comes back. A long-term holder compares stabilized income and yield-on-cost. A fund compares equity IRR under each scenario. In all cases the mechanics are the same: the allocation drives area, area drives revenue, revenue meets cost and financing, and the returns tell you which use of the land is highest and best.
This only works if the model is built to reflow. Change the residential share from 60% to 50%, and the sellable area, the sales revenue, the construction cost mix, the financing need, and the returns should all update together. That is the test of a structured area statement: the scenario takes minutes, not days.
Why this matters before anything else gets built
Costs, financing, pre-sales mechanics, operating projections, returns, all of it comes later in the model and all of it sits on top of the area statement. That is why this is the first article in the construction-phase series, and why area planning is the first module in any model I build.
Next in this series: structuring construction costs, hard costs, soft costs, contingency, developer fee, and the cash versus in-kind land question.
Working on a highest and best use decision for a KSA land parcel?
I take on selective advisory engagements for real estate developers, family offices, and investors across KSA and the GCC. Feasibility studies, area optimization scenarios, IC presentations, and the structured modeling this article describes.