The series so far has built one project: a 50,000 sqm parcel turned into an area statement, then a cost stack of SAR 887M. This article starts the revenue side, and it starts with the hardest part: residential pre-sales.
Pre-sales is difficult not because the math is advanced, but because three different curves move at once, on different shapes, answering different questions. A model that collapses them into one number will be wrong in three different ways.
Start with what is actually for sale
From the area statement: the residential component carries 75,000 sqm of GFA, of which 60,000 sqm is net sellable area at 80% efficiency. At an average unit size of 120 sqm, that is roughly 500 units. At an average price of SAR 12,000 per sqm, gross development value is SAR 720M.
Note what happened there: the revenue ceiling was set two articles ago, in the area statement. Corridors and cores were built and paid for in the cost stack, but they cannot be sold. This is the first place pre-sales models overstate: applying price to GFA instead of sellable area inflates GDV by 25% in this example.
The sales program: velocity and the off-plan split
Not all 500 units sell at once, and not all sell before completion. The model needs a sales curve: how many units sell per period, at what price, and the split between off-plan sales during construction and post-completion sales.
In the worked example: 70% of units sell off-plan across the construction period, and 30% sell after completion. The off-plan share is a real commercial decision with real modeling consequences: it accelerates cash but usually at earlier, lower price points, and it commits the developer to delivery obligations that the collections mechanics then track.
The payment plan: installments mapped to milestones
Off-plan buyers do not pay on signing. They pay on a plan. A typical structure in the example: 10% at booking, 60% in construction-linked installments, 30% at handover.
The critical modeling point: installments are mapped to construction milestones, not calendar dates. If the structure reaches 40% completion in month 18 instead of month 15, the installment lands in month 18. The collections curve follows the build. A model that spreads collections evenly across the calendar decouples cash from construction, and the financing plan built on it will be wrong exactly when construction slips, which is exactly when the financing plan matters most.
The recognition rule: capped by completion
Now the accounting layer. Under over-time revenue recognition, which is how most off-plan residential in KSA is treated, revenue is recognized in proportion to progress, measured typically by cost incurred or physical completion.
The rule to internalize: recognized revenue on sold units cannot run ahead of completion. Sell a unit worth SAR 1M when the project is 40% complete, and the P&L recognizes SAR 400K, not SAR 1M and not whatever cash has arrived.
The worked snapshot: end of Year 2
Put the pieces together and take a snapshot at the end of Year 2:
- Contracts signed: SAR 400M of value sold to date. The sold curve.
- Cash collected: SAR 200M, roughly 50% of sold value, because the installment plan follows milestones. The collections curve.
- Construction completion: 40%.
- Revenue recognized: SAR 400M x 40% = SAR 160M. The P&L curve.
- Unearned revenue: SAR 200M collected minus SAR 160M earned = SAR 40M, sitting as a liability on the balance sheet.
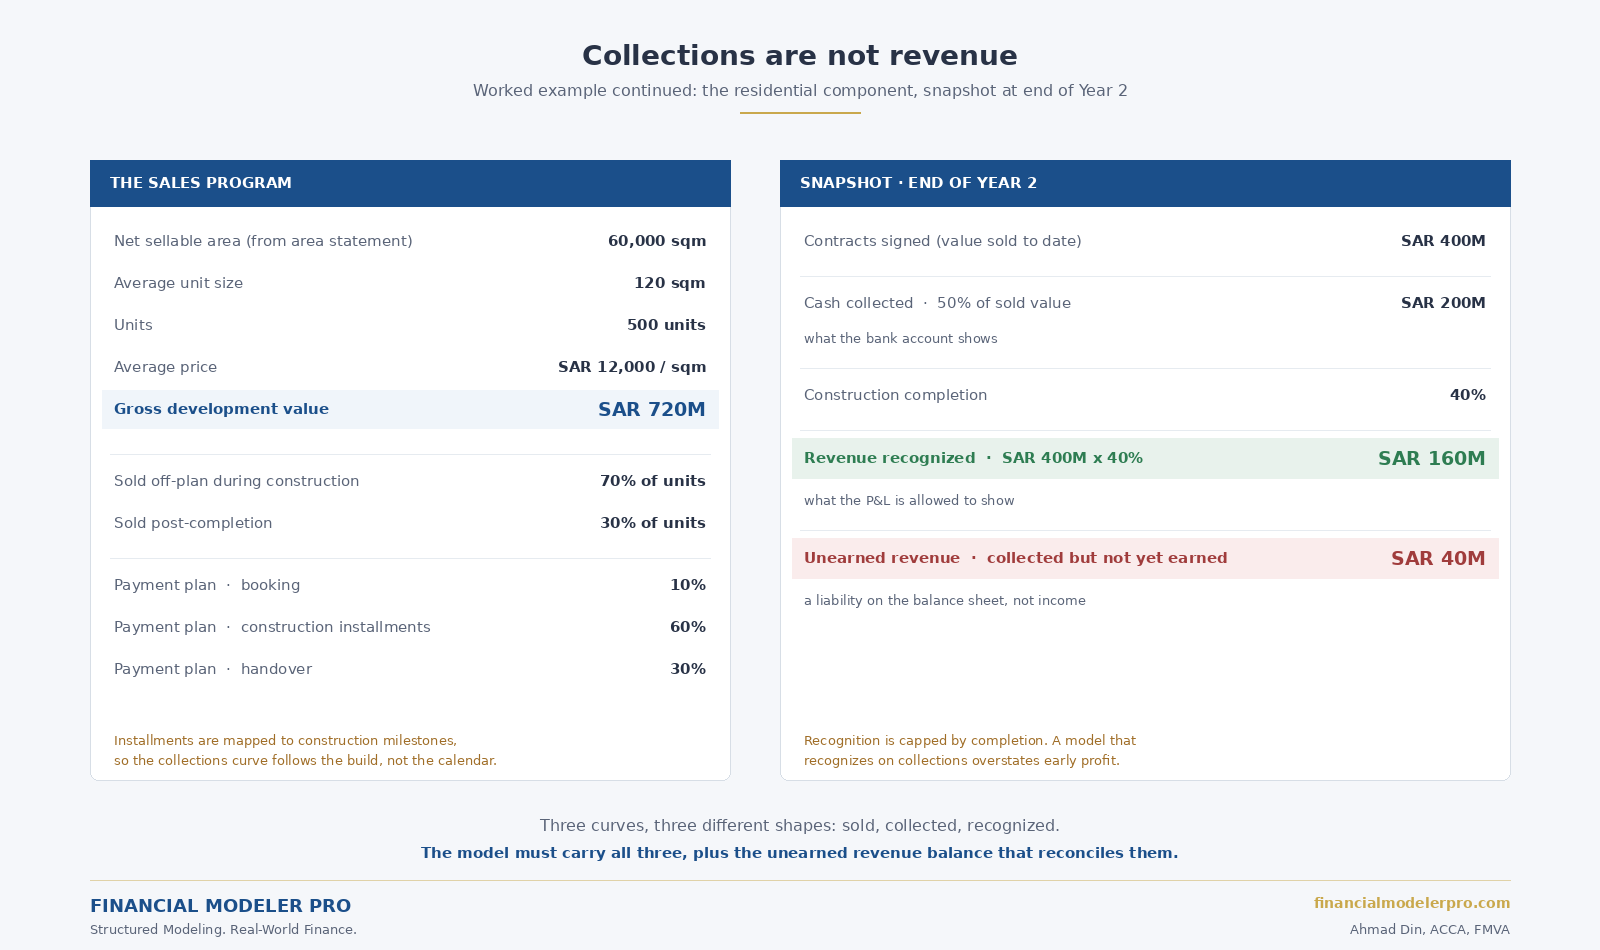
Unearned revenue is the reconciling balance between cash and P&L. It is money received for performance not yet delivered. As construction progresses, it unwinds into recognized revenue. In a period where completion advances faster than collections, the balance can swing the other way, into a contract asset, revenue earned but not yet billed. A structured model carries this balance explicitly and lets it move in both directions.
Why a model must carry all three curves
Each curve answers a different audience:
- The sold curve tells the sales director and the board whether the program is on track.
- The collections curve tells the treasurer and the lender what cash is available, and it is the curve that services debt.
- The recognition curve tells the CFO and the auditor what the P&L shows, and it drives reported profit and Zakat.
A model that recognizes revenue on collections overstates early profit and misleads the P&L. A model that ignores collections cannot size the financing. A model that only tracks contracts signed answers neither. All three, plus the unearned revenue balance that ties them together, is the minimum structure for defensible pre-sales modeling.
Post-completion sales: the simple case
The 30% of units that sell after completion are straightforward by comparison. The unit exists, the buyer pays on a short plan or at once, and revenue is recognized at handover, in full. No completion cap, no unearned balance, just a sale. The complexity of pre-sales is entirely a product of selling something that is still being built.
Next in this series: cost of sales, matched to recognized revenue rather than to collections, and the operating assets, hotel and retail, that run on entirely different revenue engines.
Modeling an off-plan residential program in KSA?
I take on selective advisory engagements for real estate developers, family offices, and investors across KSA and the GCC. Pre-sales structuring, feasibility studies, IC presentations, and the revenue recognition discipline this article describes.